
Django Performance: Latency Kills
Do you know how many database queries your Django pages are making? If you're like me, you probably don't know exactly. That's the beauty of the ORM; it abstracts database access to such a level that you rarely have to think about it. But do yourself a favor, and invest a few minutes in getting django-debug-toolbar up and running. Among other things, it will tell you exactly what queries and running on any given page.
Here is some example debug output for a simple record list in my current application.
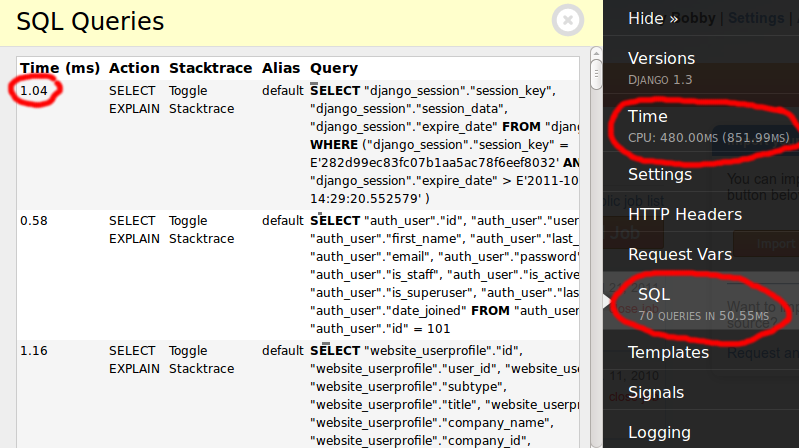
Note that the page made 70 queries. The first three, shown on the left, averaged just under one millisecond each. In fact, if I scroll down, I can see that no single query is taking over two milliseconds. In fact, all 70 of them take only 50 milliseconds. Database time is dwarfed by the total CPU time, although with the debug toolbar enabled, CPU time tends to be much higher than normal.
Where are all these queries coming from? Some are done automatically by the framework, such as the session lookup or model permissions checks. Some are done as soon as you access a property on a model, such as request.user. But most of them you're doing yourself, via statements such as Model.objects.filter(...), etc.
They pile up fast. In my experience, it's not unusual for relatively simple pages to get into the 50 to 100 query range. I have some report pages that are doing over 1,000 queries in under 300 milliseconds!
Compared to some other frameworks, especially those without an ORM, this may seem excessive. I remember writing web pages in JSP, PHP and ColdFusion with far fewer queries. Maybe 10 or 15 on a complicated page. However, those were written by hand. That's the key. When you're writing SQL by hand, the developer has a natural tendency to write fewer, but larger, queries. In Java, every query you write is wrapped in several lines of boilerplate code; hardly something you want to do too often.
On balance, I think we're better off with more, smaller, queries. It's certainly better for database performance. I remember writing literally 1000+ line queries in ColdFusion that would take hundreds of milliseconds to run (if you were lucky), maybe even locking the table for writes all the while. Sure, Django may be running 70 queries, but they are all lightning quick. They are also easier to maintain. I think we can all agree that hand-written SQL is harder to maintain (and no fun, anyway).
But the hidden killer here is server to server latency. We're used to thinking about latency between clients and servers. Over the internet, seeing a latency over 100 millisecond is not unusual. In fact, even at the speed of light, your packet cannot even theoretically get from the east coast of the united states to the west coast in under 40 milliseconds. Factor in sub-optimal routing, and you're easily in the hundreds of milliseconds.
But inside your hosting environment, server to server latency should be much lower. Amazon EC2 hovers around .5 milliseconds. Yes, half of one millisecond. My experience on Slicehost/Rackspace has been similar.
However, what would happen if that latency spiked to "just" 10 milliseconds? Your 100 query page just jumped from 50 milliseconds of latency overhead to one full second. The 1,000 query page? That just went from half a second to 10 full seconds! That kind of slowness can obliterate any other performance work you're doing.
The good news is that sub-millisecond latency is totally standard. However, you would be smart to setup some kind of server to server latency monitoring. We use Nagios with the built-in PING plug-in, set to alert us if it jumps over 10 milliseconds consistently. This can lead to some entertaining conversations with tech support. "Honestly, we do consider 18 msec ping times to be within standard operating parameters."
If anyone tries to tell you that, feel free to send them to this blog post.