Fixing styling incompatibility with Google Charts and Twitter Bootstrap
Ran into a vexing issue this week when we upgraded to using Twitter Bootstrap. Some of our analytics graphs using Google Charts were suddenly broken in IE 7/8/9. Instead of the expected 100px wide bar graphs, they were just a few pixels wide.
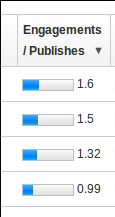
Normally Google Charts produces the following DOM for their bar graphs.
<span style="padding: 0; float: left; white-space: nowrap;">
<img style="padding: 0px;" src="/images/bar_s.png" height="12" width="1">
<img style="padding: 0px;" src="/images/bar_b.png" height="12" width="16">
<img style="padding: 0px;" src="/images/bar_w.png" height="12" width="34">
<img style="padding: 0px;" src="/images/bar_s.png" height="12" width="1">
1.6
</span>It turns out that the issue is with Bootstrap’s CSS for responsive images, and in particular the img { width: auto; } declaration. It causes older versions if IE to ignore height and width attributes that are set directly on the DOM element. This issue has come up before in other contexts. Removing the offending CSS solves the issue, but I wanted to stick with vanilla Bootstrap so we could cleanly upgrade to new vesions. Likewise, you probably don’t want to edit the Google Charts javascript.
Instead, you can layer in some additional javascript, fired on the Google Charts onReady event, to add inline width declarations into the style attribute for the images. While IE 7/8/9 ignore width attributes when combined with img { width: auto; }, it does respect style attributes.
function fixGoogleChartsBarsBootstrap() {
    /* Google charts uses <img width="12px">, which is incompatible with Twitter
     * bootstrap in responsive mode, which inserts a css rule for: img { width: auto; }.
     * On IE7/8/9, that causes the browser to ignore the width attribute, and
     * the bars are collapsed to 1px each.
     *
     * The fix is to use inline style width attributes, ie <img style="width: 12px;">.
     * BUT we can't change the way Google Charts renders its bars. Nor can we change
     * the Twitter bootstrap CSS and remain future proof.
     *
     * Instead, this function can be called after a Google charts render to "fix" the
     * issue by setting the style attributes dynamically.
     */
    $("img[width]").each(function(index, img) {
        img.css("width", img.attr("width"));
    });
};