
Getting started with Splunk as an Engineer
What is Splunk, and how can you make the best use of it as an engineer? Splunk is first and foremost a hosted web-based tool for your log files. It gives you the following:
- Aggregates all your logs in one place
- Search
- Extract meaning
- Group, join, pivot and format results
- Visualization
- Email alerts
Architecture
How does it work? You setup all your servers to forward certain log statements to a centralized cluster of Splunk servers via rsyslog. Alternatively, you can use SFTP, NFS, etc. I don’t want to re-hash install steps here. Instead, let’s focus on what you can DO with it once all your logs are in there.
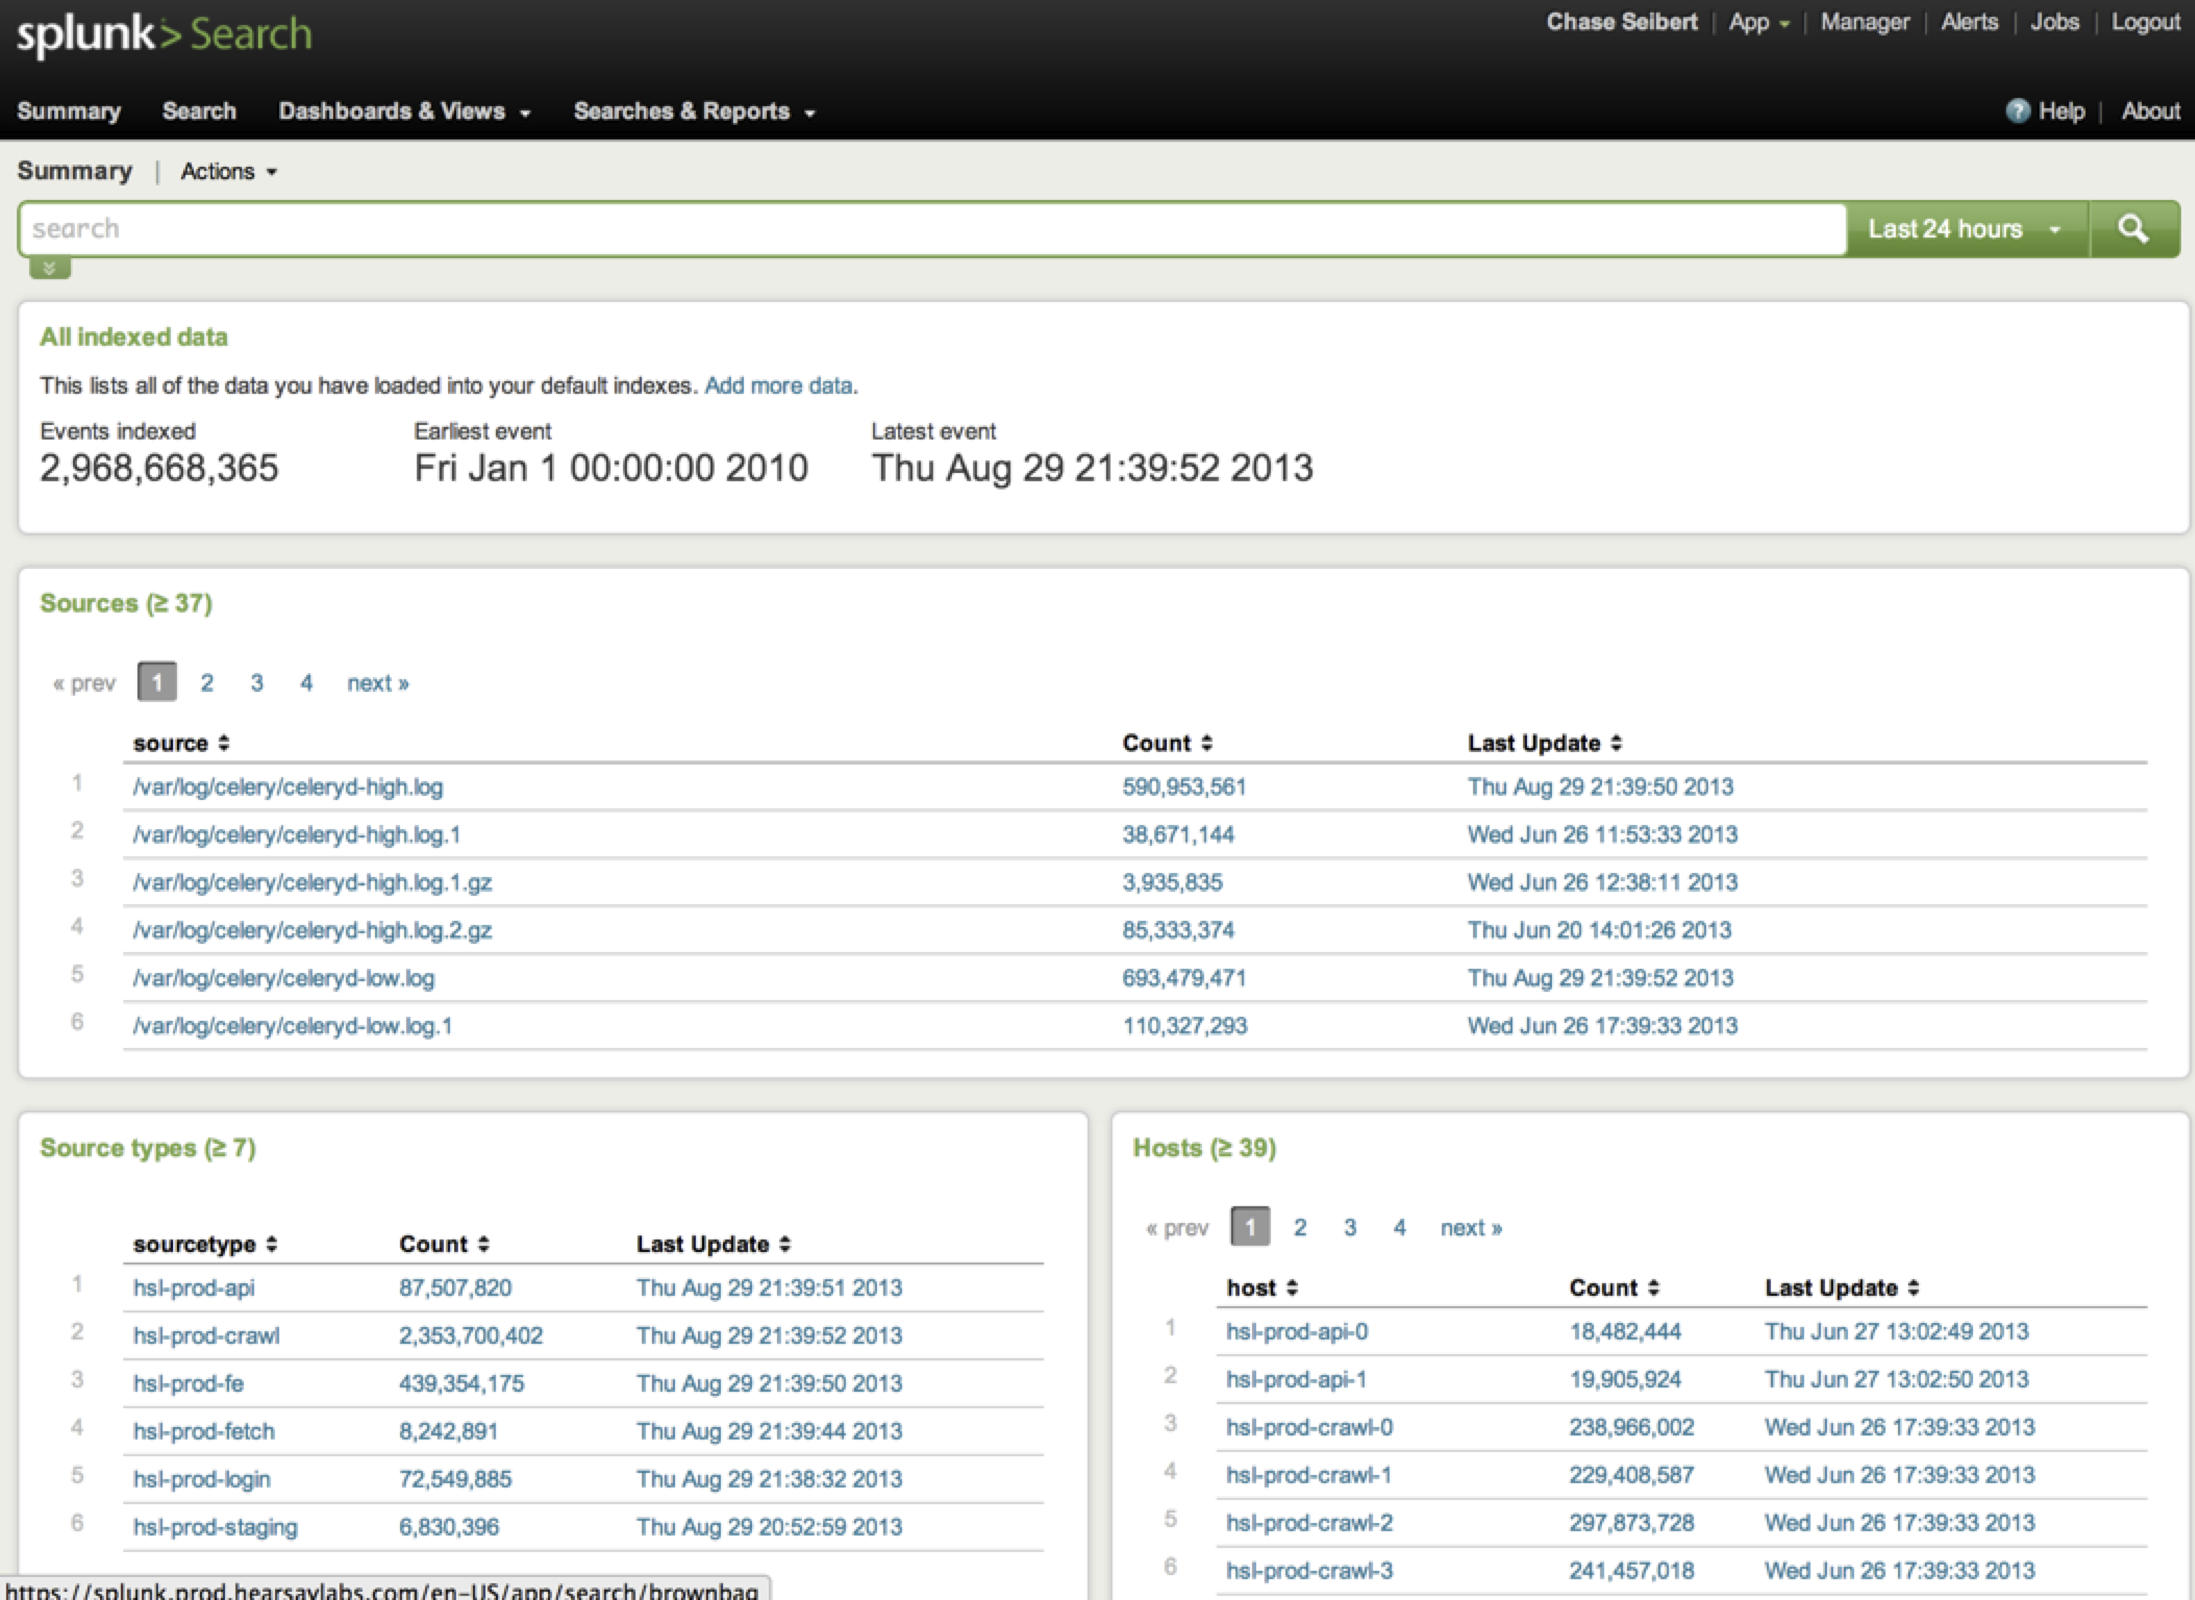
Hosts and Sources
The first thing you will notice is that your log files are broken down by host, and optionally by source. This means that you can quickly search all the logs from one machine, or from a logical group of machines (ex: web servers versus database servers).
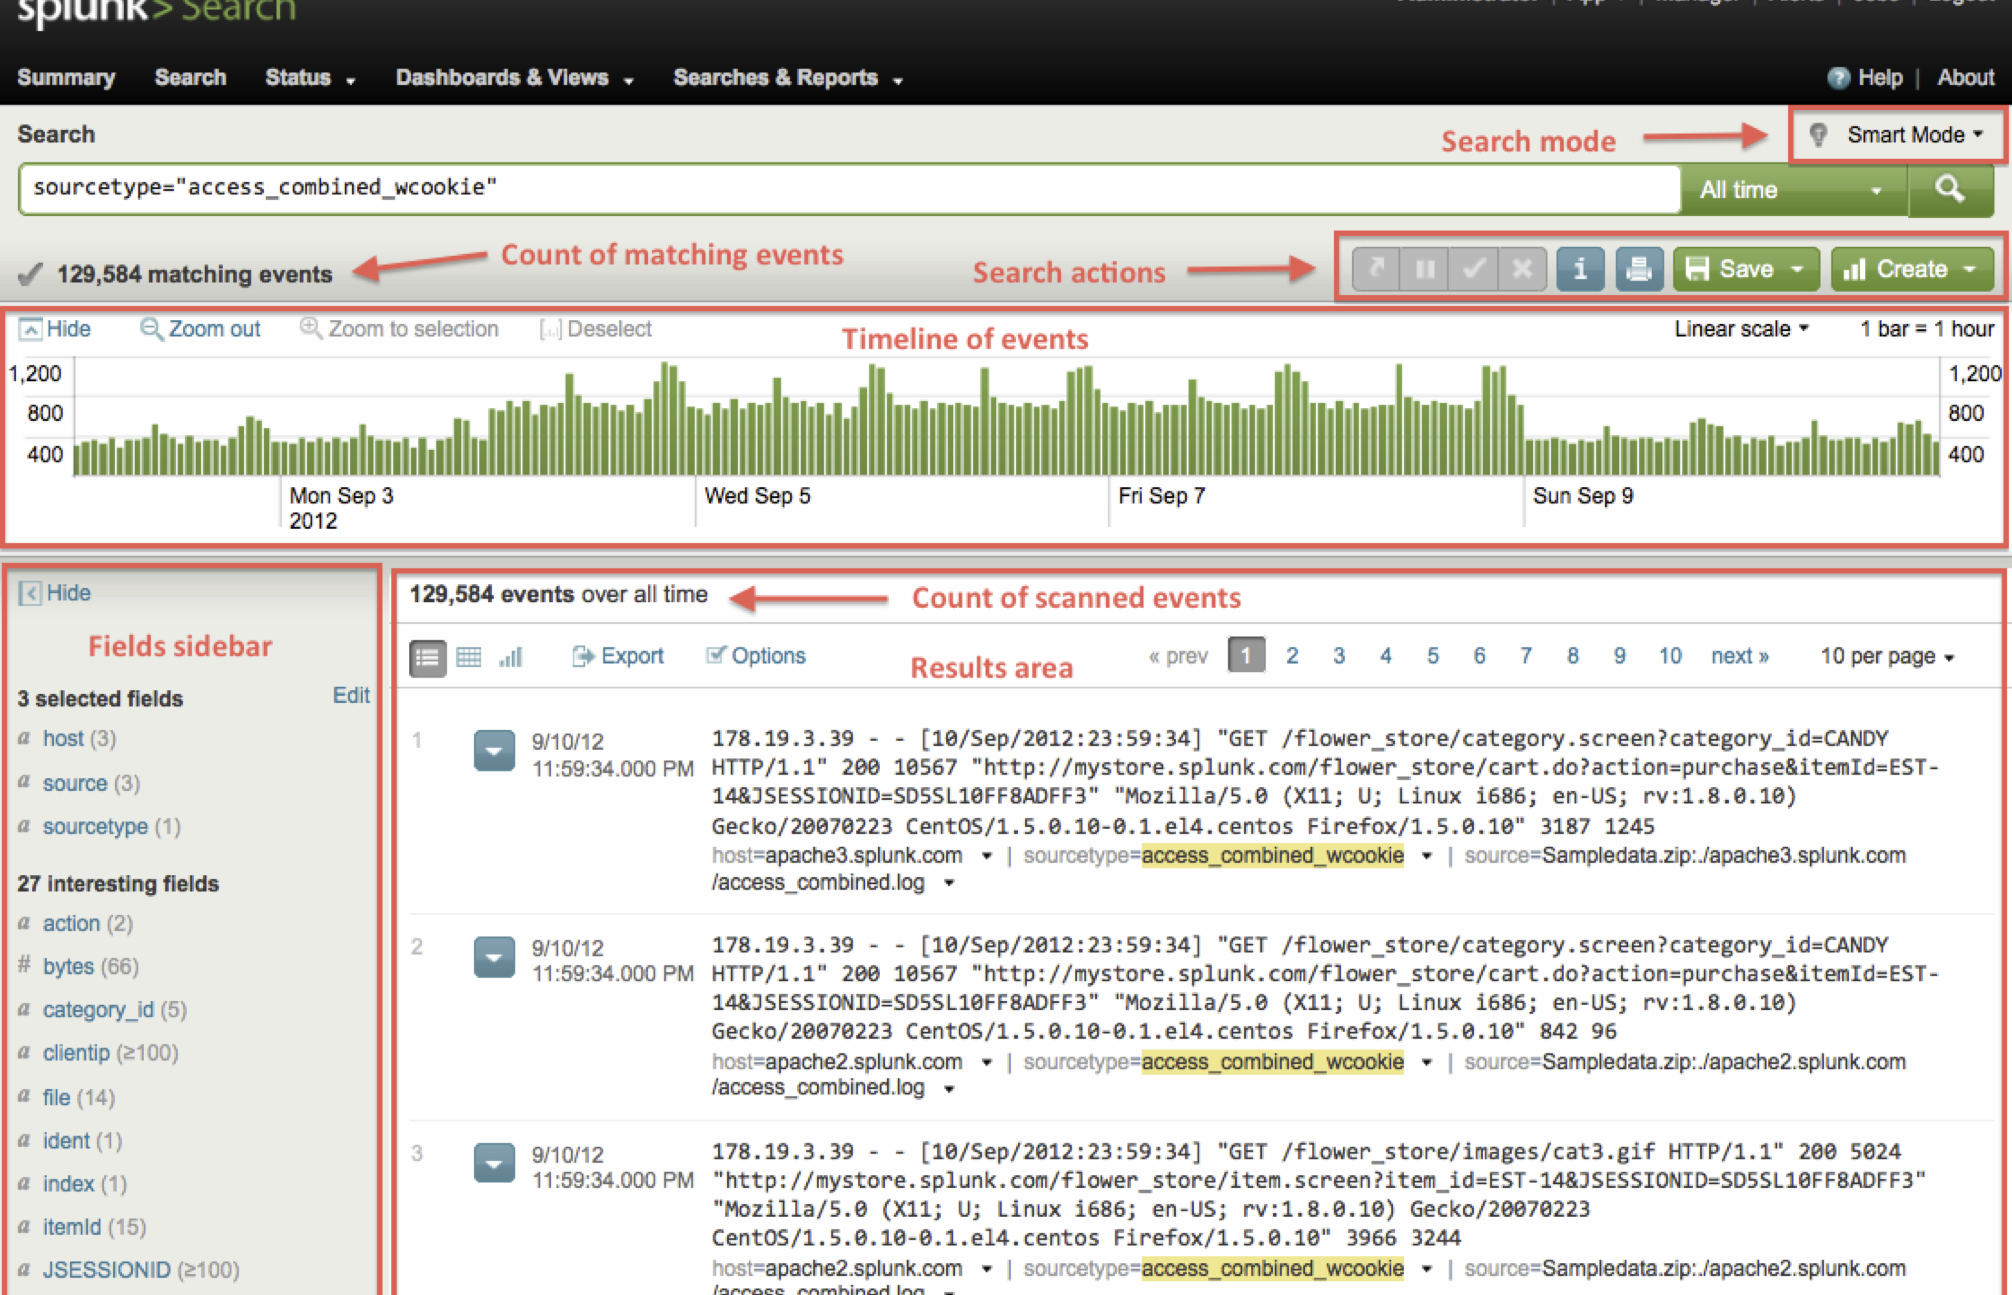
Searching
Searching is pretty easy to use, just type in a search string! You can also do more complicated stuff. Examples:
sourcetype="hsl-prod-fe" "Chase Seibert"sourcetype="hsl-prod-fe" e186f85c914261eec9e54d3767fdd3cc BEGINsourcetype="hsl-prod-crawl" |regex _raw="fanmgmt\.(analytics|metrics)"sourcetype="hsl-prod-crawl" facebook OR twitter NOT linkedinsourcetype="hsl-prod-crawl" facebook OR linkedin OR twitter earliest=-24h
Extracting
This is where is starts to get interesting. You can use a built-in GUI to define a custom regex to pull pieces of your lines into variables, which you can then filter, group and aggregate by.
If you can change your log format, you can get this to happen automatically without defining a regex by putting key/value pairs into key=value format. Here is some example code:
def key_value(prefix, log_level='info', **kwargs):
    log_message = '%s: %s' % (
        prefix, ' '.join(['%s="%s"' % (k, v) for k, v in kwargs.items()]))
    getattr(logging, log_level)(log_message.strip())
Piping
Just like in Unix, you can pipe various commands together to produce more complicated behavior in your searches. Example: sourcetype="hsl-prod-crawl" succeeded |stats count perc95(task_seconds) by python_module |sort count desc |head 10.
Other basic pipe commands:
| uniq| script python myscript myarg1 myarg2| bucket _time span=5m| eval name=coalesce(firstName, lastName)| rare, | anomalous| spath output=commit_author path=commits.author.name # extract xml/json values
Other functions you can call:
avg()| eval description=case(error == 404, "Not found", error == 200, "OK")floor(), ceiling()len()isbool(), isint(), etcupper(), lower()trim(), ltrim(), rtrim()md5()now()random()replace()split()substr()
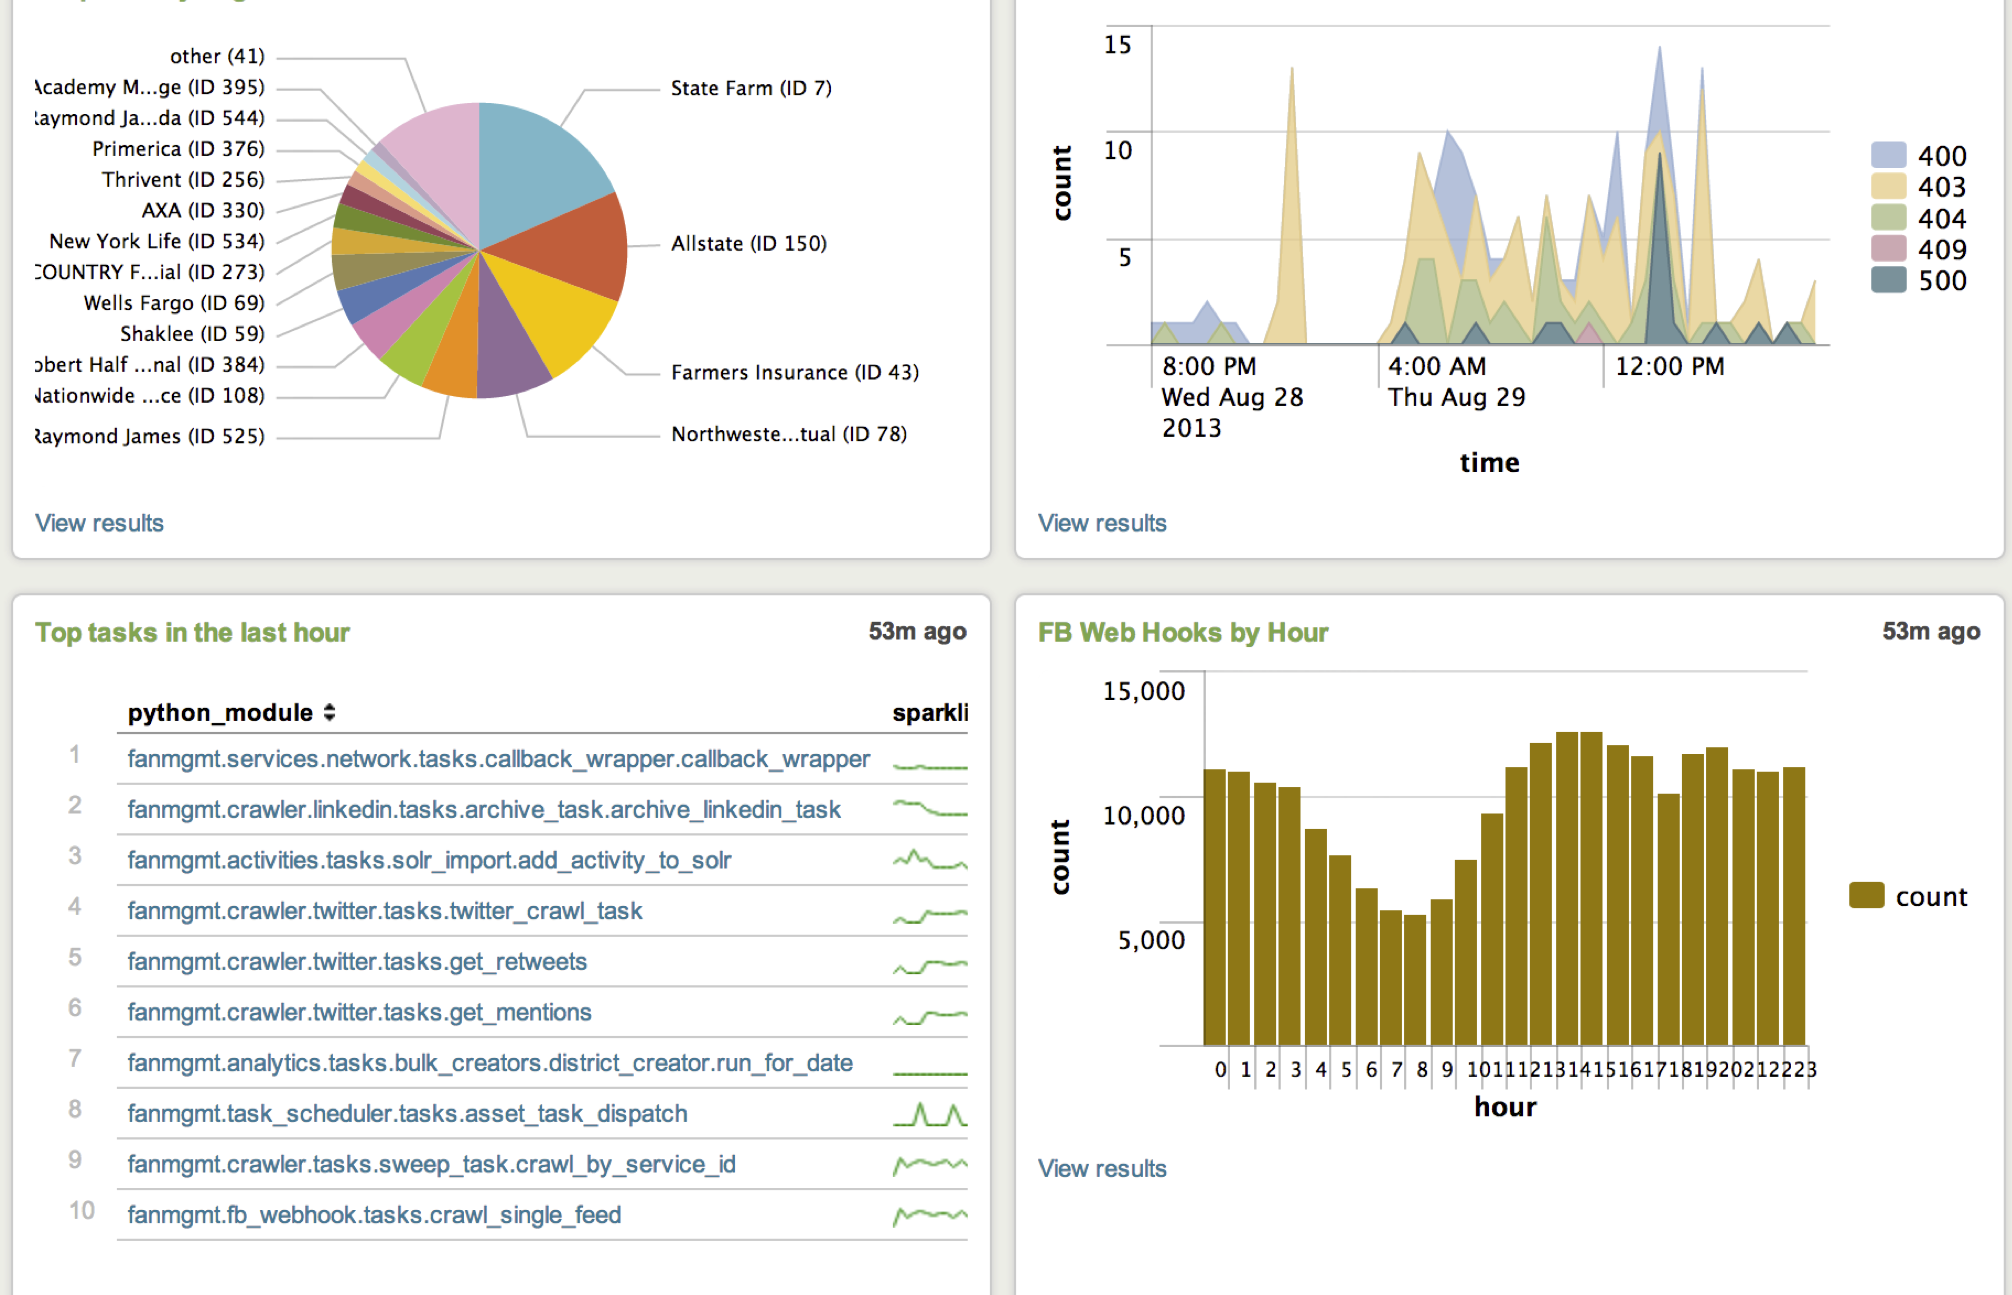
Visualizations
It’s easy to create graphs and charts by pointing and clicking your way through their GUI builder. You can also do the same thing with raw commands and functions, assuming you know what to call. You can create pie charts, bar, columns and line graphs, as well as more complicated stuff like gauges.
Email Alerts
Finally, you can configure Splunk to send you email alerts based on a cron schedule when certain searches either produce or do not produce certain results. Alerts:
- Start with a regular search
- Take a time window
- Can be scheduled (supports cron syntax)
- Can alert always, or when num rows > N
- Can remember not to re-alert on the same items
- Sends an email, or publishes to an RSS feed