
Splunk/Rsyslog/Apache/Ubuntu Quickstart
I've been using Splunk for several years. It's a great tool for log file visualization and analytics. One thing I use it for is to generate a graph of average milliseconds per request on an apache instance. Up until recently, I was running this directly on the production web server.
Lately, it became clear that we needed to move this to a dedicated machine. For one thing, we were about to add a second apache server. Also, I have noticed that running this report hammers the server pretty hard, especially if you're doing field extraction on the fly. In any case, I decided it was time to look into syslog.
Syslog is a standard for logging program messages. It allows separation of the software that generates messages from the system that stores them and the software that reports and analyzes them. It also provides devices which would otherwise be unable to communicate a means to notify administrators of problems or performance. - Wikipedia
In practice, the specific feature of syslog I wanted to leverage was the forwarding of log events from the production machine(s) to the Splunk server. In Splunk, the setup is just enabling TCP data inputs.
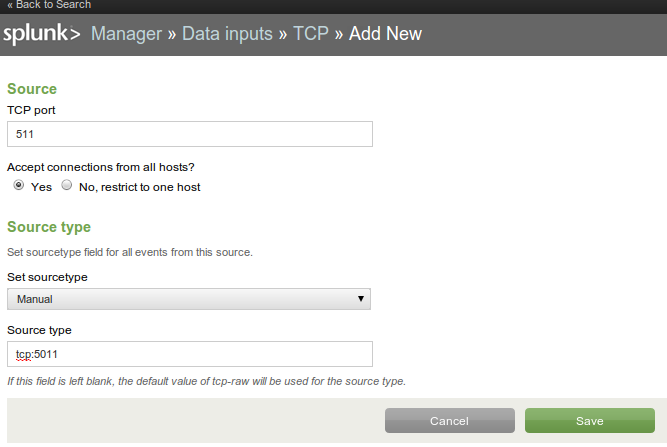
Port 5011 is a commonly unused port I chose at random. In my case, I also needed to open this port in iptables (the firewall) on the Splunk server.
iptables-save > /etc/iptables.conf
vim /etc/iptables.conf

# add the following (allow the 10.177 subnet to open TCP port 5011 to the Splunk server)
-A INPUT -s 10.177.0.0/16 -p tcp -m tcp --dport 5011 -j ACCEPT

/sbin/iptables-restore < /etc/iptables.conf
On a current Ubuntu installation, syslog service is provided by rsyslog. The first step is to configure rsyslog to forward log events to the Splunk server. In my case, the Splunk server is at 10.177.0.204.
vim /etc/rsyslog.d/50-default.conf

# add the following, which defines a common format, and then forwards ALL syslog events
$template SyslFormat,"%timegenerated% %HOSTNAME% %syslogtag%%msg:::space$
*.* @@10.177.0.204:5011;SyslFormat

service rsyslog restart
Again, I also needed to open port 5011 (outbound this time) in iptables.
-A OUTPUT -p tcp -m tcp --dport 5011 -j ACCEPT
At this point, you should start seeing syslog events in Splunk. An easy way to test it is to restart rsyslog. You should see the log events for shutting down/starting the rsyslog process. If not, you may want to try the following trouble-shooting steps. In my case, I initially ran into trouble because I was assuming the traffic was being sent over UDP, but in rsyslog it's TCP by default.
# tail the local syslog file, make sure events are being generated
tail -f /var/log/syslog

# try to open a port from the apache server to the splunk server, it's successful unless you see connection refused
telnet 10.177.0.204 5011

# try to open port 5011 on the Splunk server itself
telnet localhost 5011
The next step is to get Apache to log to syslog. In my case, the following was sufficient to log anything that Django prints to the console.
vim /etc/apache2/sites-available/default

# add the following, logs most events in syslog
ErrorLog syslog:local7

service apache2 restart
Now you should be getting Apache + other syslog events into Splunk. But they all show up with a source type of "tcp:5011" by default. What's happening is that Splunk is seeing them all as the same virtual log file. Luckily, there is an easy configuration to break them out into separate source types.
vim /opt/splunk/etc/apps/search/default/props.conf

# add the following to act on anything from tcp:5011
[source::tcp:5011]
TRANSFORMS-yummy = setSourceApache, setSourcePostfix

vim /opt/splunk/etc/apps/search/default/transforms.conf

# add the following to define setSourceApache and setSourcePostfix
[setSourceApache]
DEST_KEY = MetaData:Sourcetype
# any log line that contains apache2
REGEX = apache2
FORMAT = sourcetype::apache

[setSourcePostfix]
DEST_KEY = MetaData:Sourcetype
REGEX = postfix
FORMAT = sourcetype::postfix

/opt/splunk/bin/splunk restart
Finally, while you're trouble-shooting all of this, you will likely be generating junk log events. If you find yourself wanting to start over, you can aways bring up a set of results in Splunk, and just pipe the search to "|delete" to blow them away.