Debugging an IE7 browser crash (manual git bisect)
Every once in a while, you have to put in a heroic effort to diagnose a bug. When you finally figure it out, you want to run around the office singing “We are the champions”, even if it turns out to be a trivial issue. Because that doesn’t mean it took a trivial amount of effort.
Recently I had a bug report cross my desk that our web app was crashing IE7. Luckily IE7 is only about 3% of our overall userbase. As of May 2014, it’s only about .2% of global browser market share, but we have a lot of enterprise customers who are slower to upgrade. Regardless, definitely a high severity bug.
As an aside, I find browser crashes to be ridiculous. I know this browser was written back in the dark ages of 2005, but still. If you’re implementing a browser, you know you are basically going to be taking random markup and javascript from essentially an untrusted user. You would think you would be as meticulous as possible to trap every conceivable exception.
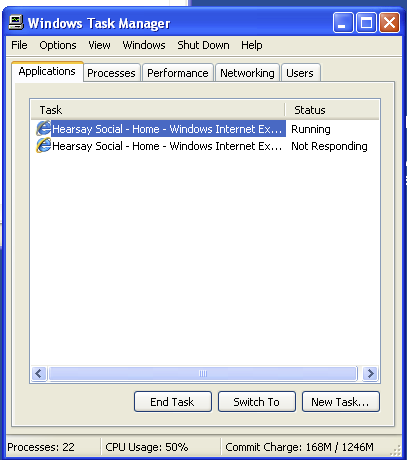
But no. In the case of a browser crash, you don’t get a stack trace. You don’t even get the dreaded “Object Expected” error (the single most useless error of all time). What puny developer tools that Microsoft deigned to provide back in 2005 are of absolutely no use. Instead, all you see is a white screen and the following:

So it begins. In this case, I assume that we were not crashing IE7 at some point in the recent past. Otherwise, we would have presumably received this bug report earlier.
The first step is always to get a reproducible. I can reproduce using my trusty
IE7 VirtualBox image provisioned from xdissent/ievms.
Knowing I’m in for a long haul, I also make some effort to get my reproducible steps
down to the smallest quickest nugget I can. First, I create a shortcut on my Windows
desktop called “clear cache”, with the following Target: RunDll32.exe InetCpl.cpl,ClearMyTracksByProcess 255.
I know from experience that if you don’t clear your cache between tests, you will be
hunting phantom cached files for hours. I make another shortcut with a direct link
to the page that crashes on my dev box.
I proceed to spend about an hour deleting random chunks of suspect code to see if I
can get it to stop crashing. If I’m successful, I start putting some of the deleted
code back in until it crashes again. This is a slow process. Sometimes it helps to
go old school and put actual alert() calls in between suspect lines. I finally
narrow it down to a require.js call to import a completely different file. Basically,
I have to start over on a new file.
So I change tactics and start what is essentially a binary search through our git history to locate the exact commit where this occurs. Note: if you can repo your issue purely on the command line, you should use git bisect for this. I start rolling back 10, 100, 1000 commits until I get a working build. I have to manually refresh a browser each time.
git checkout upstream/master~10
git checkout upstream/master~100
git checkout upstream/master~1000
At 1,000 commits, I get a working build again. So I try 500 commits ago. Not working. 750 commits. Working. 625 commits, etc… After a surprisingly few iterations, I’m left with a small set of potential breaking commits, which I manually browse through until I see this:

From experience, I suspected all along that this was likely either an unclosed HTML tag in a javascript template, or an extra comma. I have seen both crash old versions of IE. What’s super-frustrating is that this is actually something that our automation catches:
>jshint bad_file.js
static/js/bad_file.js: line 611, col 45, Extra comma. (it breaks older versions of IE)
But we rely on individual engineers to install the automation and run it, which they can also opt-out on for individual commits and files. In any case, it turned out to be a one character fix after about 3 hours of work. In the future, I would save some time by just running jshint on the entire repo.
