
Designing a Dimensional Schema for a hierarchy that can change over time
I’ve recently been reading about dimensional schemas, aka star schemas. The whole idea seems to be to optimize for fast queries that are also simple to write, at the expense of extra storage in the form of denormalization. In contrast to standard third normal form relational database schema, there is little to no emphasis on how complicated it will be to write data into the system. This trade-off makes sense, as star schemas are employed primarily for data warehouses, where the user will be a business intelligence analyst writing ad-hoc queries to pull analytics, not an ORM layer or another piece of pre-vetted code hitting previously defined and approved indexes.
The schema itself can be counter intuitive for engineers who have only worked on normal RDMS schemas. First off, data is broken down into fact tables, which are the events that the analytics are aggregating, and dimension tables, which are the attributes that the events will be rolled up by. For example, we are going to use the fact of social media posts as an example, while the dimensions will be the group that the posting user works at in their company, together with that groups place in the company org chart. To up the level of difficulty, we are also going to talk about how to model an org chart that is changing over time.
The Problem
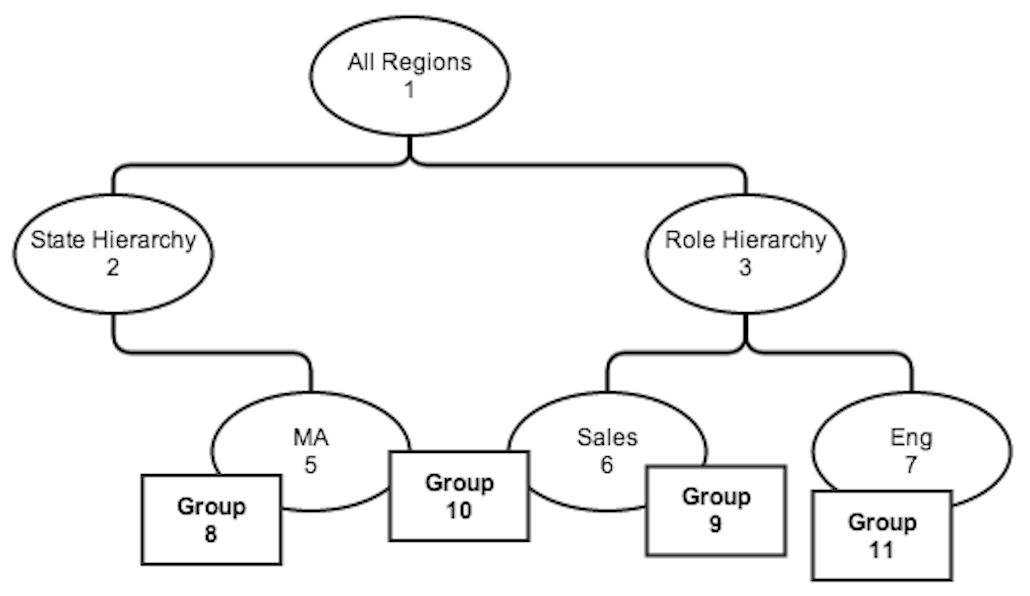
Here we have a somewhat complicated org chart, albeit a small one. Group 10 happens to roll up to both the State and Role hierarchies. This is known as a multi-hierarchy system. The company wants to be able to report on posts made by that group from two different perspectives, depending on the specific report they are trying to run.
Two particular challenges talked about in the excellent The Data Warehouse ETL Toolkit are modeling hierarchies (which are essentially trees, and also difficult to model in traditional RDMS systems) and slowly changing dimensions. For example, what happens if a group moves to a different spot in one of the hierarchies, but the company still wants to report on their posts according to the hierarchy they were actually in at the time? More on that later.
Test Schema and Data
Here is one model for the hierarchy information, aka the Region Bridge Table, or test_region_bridge. For each of these tables, I will also give the SQL to create the table and insert the same test data.
| parent_distdict_id | parent_distdict_name | child_distdict_id | child_distdict_name | depth_from_parent |
|---|---|---|---|---|
| 1 | All Regions | 2 | State Hierarchy | 1 |
| 1 | All Regions | 5 | MA | 2 |
| 2 | State Hierarchy | 5 | MA | 1 |
| 1 | All Regions | 3 | Role Hierarchy | 1 |
| 1 | All Regions | 6 | Sales | 2 |
| 3 | Role Hierarchy | 6 | Sales | 1 |
| 1 | All Regions | 7 | Eng | 2 |
| 3 | Role Hierarchy | 7 | Eng | 1 |
CREATE TABLE test_region_bridge (parent_district_id integer not null, parent_district_name varchar(255) not null, child_district_id integer not null, child_district_name varchar(255) not null, depth_from_parent integer not null);

INSERT INTO test_region_bridge (parent_district_id, parent_district_name, child_district_id, child_district_name, depth_from_parent)
           SELECT 1, 'All Regions', 2, 'State Hierarchy', 1
UNION ALL SELECT 1, 'All Regions', 5, 'MA', 2
UNION ALL SELECT 2, 'State Hierarchy', 5, 'MA', 1
UNION ALL SELECT 1, 'All Regions', 3, 'Role Hierarchy', 1
UNION ALL SELECT 1, 'All Regions', 6, 'Sales', 2
UNION ALL SELECT 3, 'Role Hierarchy', 6, 'Sales', 1
UNION ALL SELECT 1, 'All Regions', 7, 'Eng', 2
UNION ALL SELECT 3, 'Role Hierarchy', 7, 'Eng', 1;
Notice that every node has a row for each of their children, whether they are direct children (depth 1) or further down. This is intended to make it possible to query for all groups under a certain level without explicitly listing all the children in a dependent sub-query. The parent and child names are given just to make it easier to see what your queries are doing.
Here is the test_post table. Notice that it has a group_id, but not a district_id.
| post_id | group_id | text | date |
|---|---|---|---|
| 1 | 8 | foo | 2014-06-01 |
| 2 | 9 | bar | 2014-06-05 |
| 3 | 11 | bat | 2014-06-20 |
| 4 | 11 | baz | 2014-06-30 |
| 5 | 10 | far | 2014-06-10 |
CREATE TABLE test_post (hss_post_id integer not null, group_id integer not null, text varchar(255) not null, date timestamp not null);

INSERT INTO test_post (hss_post_id, group_id, text, date)
           SELECT 1, 8, 'foo', DATE('2014-06-01')
UNION ALL SELECT 2, 9, 'bar', DATE('2014-06-05')
UNION ALL SELECT 3, 11, 'bat', DATE('2014-06-20')
UNION ALL SELECT 4, 11, 'baz', DATE('2014-06-30')
UNION ALL SELECT 5, 10, 'far', DATE('2014-06-10');
Finally, here is the test_group_region_bridge table, which joins group_id to district_id:
| group_id | district_id |
|---|---|
| 8 | 5 |
| 9 | 6 |
| 10 | 5 |
| 10 | 6 |
| 11 | 7 |
CREATE TABLE test_group_region_bridge(group_id integer not null, district_id integer not null);

INSERT INTO test_group_region_bridge (group_id, district_id)
           SELECT 8, 5
UNION ALL SELECT 9, 6
UNION ALL SELECT 10, 5
UNION ALL SELECT 10, 6
UNION ALL SELECT 11, 7;
Example Queries
Given this schema, how would we write a query to answer the question How many posts were there in each region under the Role Hierarchy between Jun 1, 2014 and Jun 30, 2014?
SELECT r.child_district_name,
       COUNT(*)
  FROM test_post p
 INNER JOIN test_group_region_bridge gr
    ON gr.group_id = p.group_id
 INNER JOIN test_region_bridge r
    ON r.child_district_id = gr.district_id
 WHERE r.parent_district_name = 'Role Hierarchy'
   AND r.depth_from_parent = 1
   AND p.date BETWEEN '2014-06-01' AND '2014-06-30'
 GROUP BY r.child_district_name;
Note that I’m including a depth_from_parent = 1, otherwise my JOIN would include a row for any regions that might be under either Sales or Eng, and count posts in the parent regions multiple times.
| child_district_name | COUNT(*) |
|---|---|
| Eng | 2 |
| Sales | 2 |
We could also ask How many posts per day were there under the State Hierarchy?
SELECT DATE(p.date),
       COUNT(*)
  FROM test_post p
 INNER JOIN test_group_region_bridge gr
    ON gr.group_id = p.group_id
 INNER JOIN test_region_bridge r
    ON r.child_district_id = gr.district_id
 WHERE r.parent_district_name = 'State Hierarchy'
 GROUP BY DATE(p.date);
Which results in:
| date | COUNT(*) |
|---|---|
| 2014-06-01 | 1 |
| 2014-06-10 | 1 |
Also, Which posts were there under both Sales and MA?
SElECT p.*
  FROM test_post p
 INNER JOIN test_group_region_bridge gr
    ON gr.group_id = p.group_id
 INNER JOIN test_region_bridge r
    ON r.child_district_id = gr.district_id
   AND r.parent_district_name = 'All Regions'
 WHERE r.child_district_name = 'Sales'
INTERSECT
SElECT p.*
  FROM test_post p
 INNER JOIN test_group_region_bridge gr
    ON gr.group_id = p.group_id
 INNER JOIN test_region_bridge r
    ON r.child_district_id = gr.district_id
   AND r.parent_district_name = 'All Regions'
 WHERE r.child_district_name = 'MA';
This one is tricky, but shows the flexibility of SQL. It returns the correct single row.
| post_id | group_id | text | date |
|---|---|---|---|
| 5 | 10 | far | 2014-06-10 |
Taking it up a notch
Now, I promised to address what happens when we also need to account for changes in the hierarchy over time. For example, what if group 11 moved from district 7 (Eng) to district 6 (Sales) on 2014-06-18, and then moved back to district 7 (Eng) on 2014-06-22? There should still be four posts, but now there were three in Sales and one in Eng.
In order to record the relevant dates, I’ll add change_effective and change_end dates to the table, as well as a change_current to track whether this is the current state of the group. Here is our new test_group_region_bridge table.
| group_id | district_id | change_effective | change_end | change_current |
|---|---|---|---|---|
| 8 | 5 | 2000-01-01 | 2100-01-01 | 1 |
| 9 | 6 | 2000-01-01 | 2100-01-01 | 1 |
| 10 | 5 | 2000-01-01 | 2100-01-01 | 1 |
| 10 | 6 | 2000-01-01 | 2100-01-01 | 1 |
| 11 | 7 | 2000-01-01 | 2014-06-17 | 0 |
| 11 | 6 | 2014-06-18 | 2014-06-21 | 0 |
| 11 | 7 | 2014-06-22 | 2100-01-01 | 1 |
Notice that I’m using dates in the far past and far future to denote the beginning of time and the end of time, respectively. This is to make queries easier to write.
CREATE TABLE test_group_region_bridge(group_id integer not null, district_id integer not null, change_effective timestamp not null, change_end timestamp null, change_current boolean not null);

INSERT INTO test_group_region_bridge (group_id, district_id, change_effective, change_end, change_current)
           SELECT 8, 5, DATE('2000-01-01'), DATE('2100-01-01'), 1
UNION ALL SELECT 9, 6, DATE('2000-01-01'), DATE('2100-01-01'), 1
UNION ALL SELECT 10, 5, DATE('2000-01-01'), DATE('2100-01-01'), 1
UNION ALL SELECT 10, 6, DATE('2000-01-01'), DATE('2100-01-01'), 1
UNION ALL SELECT 11, 7, DATE('2000-01-01'), DATE('2014-06-17'), 0
UNION ALL SELECT 11, 6, DATE('2014-06-18'), DATE('2014-06-21'), 0
UNION ALL SELECT 11, 7, DATE('2014-06-22'), DATE('2100-01-01'), 1;
Now we can run the same region count query as before, but have it take into account that fact that the post has to have been made while the group was still in that region. You can also use the same schema to fall back to the previous behavior of looking at just the current state of the org chart with change_current = 1.
SELECT r.child_district_name,
       COUNT(*)
  FROM test_post p
 INNER JOIN test_group_region_bridge gr
    ON gr.group_id = p.group_id
 INNER JOIN test_region_bridge r
    ON r.child_district_id = gr.district_id
 WHERE r.parent_district_name = 'Role Hierarchy'
   AND r.depth_from_parent = 1
   AND p.date BETWEEN '2014-06-01' AND '2014-06-30'
   AND p.date BETWEEN gr.change_effective and gr.change_end
 GROUP BY r.child_district_name;
Smoothing out the kinks
You may have noticed that these queries are all repeating the same JOIN syntax. If you think this is going to be a common query pattern, you can create a view as a shortcut.
CREATE VIEW test_post_historical_region AS
SELECT p.*,
       r.parent_district_name,
       r.child_district_id,
       r.child_district_name
  FROM test_post p
 INNER JOIN test_group_region_bridge gr
    ON gr.group_id = p.group_id
 INNER JOIN test_region_bridge r
    ON r.child_district_id = gr.district_id
 WHERE p.date BETWEEN gr.change_effective and gr.change_end;
This will make your previous query much simpler.
SELECT DATE(p.date),
       COUNT(*)
  FROM test_post_historical_region p
 WHERE p.child_district_name = 'Sales'
   AND r.depth_from_parent = 1
 GROUP BY DATE(p.date);
This also abstracts the existence of the change_* fields from the user. The hard part is communicating what the view is doing, so query authors know when to use it, and when NOT to use it. If you want to maximize the performance of the system at the cost of extra storage, you can make this a materialized view.